
A Beginners Guide: Measuring Blog Success Using Google Analytics
October 27, 2015
Writing
Rarely. According to Statistic Brain, just 8% of New Years Resolutions are achieved. It’s a sad story, isn’t it?
Most are set with the best intentions. “I’ll lose some weight” or “I’ll eat less chocolate”. After a few weeks of sticking to your latest diet, it gets tiresome and you start to let bad habits creep in once again.

Setting traffic, content or growth goals can make a huge difference, particularly when marketing inbound, because you have something to aim for. It’s better than just stating that you want ‘more visitors’. The majority of successful blogs measure and analyze their performance.
Which goals should you check, and how do you measure them? We can help! In this guide we’ve provided a list of goals you could set for yourself and your inbound marketing team.
We know it can be tricky at the start. It’s difficult to know what to measure, why you should measure it and how to find the metrics you’re after.
At Contentacle, we use Google Analytics for this, so I’ve included some tips about how to dig out the data.
Traffic Goals

If you’re looking to get the word out about your blog or gain interest for your product, setting a traffic goal is a great idea.
Remember though, it needs to be specific (e.g. 2,000 page views on the blog every day). Do you want to only count unique views, or all views?
Unique Users
This statistic helps you analyze how many different users visited your site. This is useful in understanding how popular your website is, and where your visitors are coming from.
There’s two types of unique user: new users and returning users. New users are the people that visited your site for the first time ever that day. Returning users have been before, and are coming back for that awesome content you’re writing.
New Users
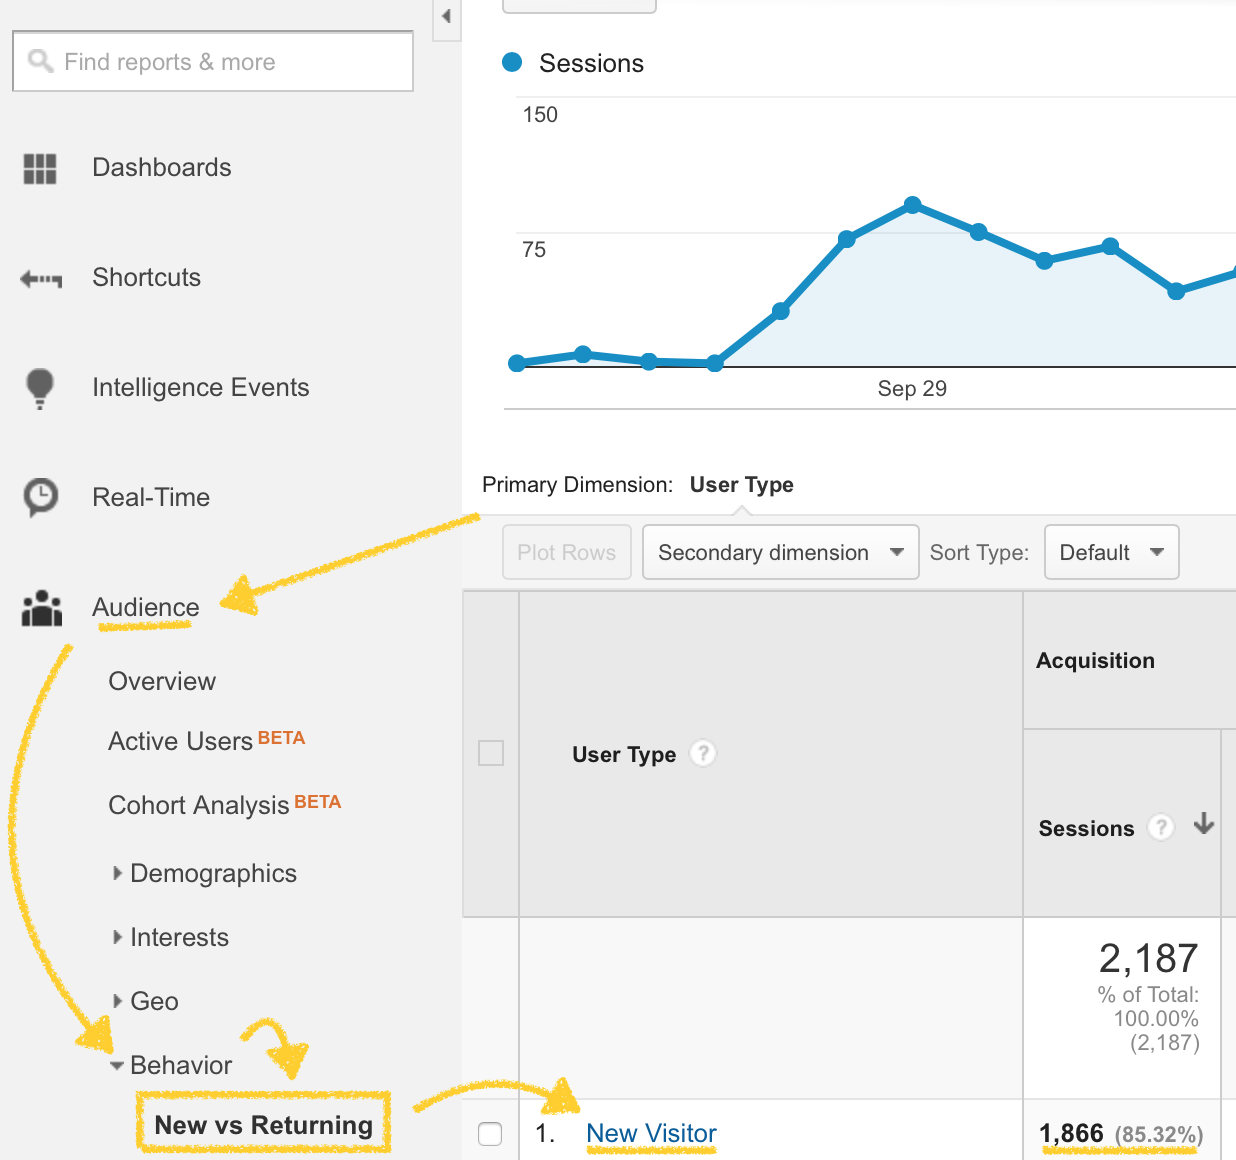
Let’s take a look at how to find your new users on Google Analytics:
- Click on Audience in the sidebar
- Click Behaviour
- Click New vs Returning
- Your new user count will be next to New Visitor
Returning users
You should also keep an eye on your returning users. Why?
If you’re looking to build a community around your blog, you want people to return to your site and come back for more amazing content. This is what all successful blogs strive for.
Measuring how many returning visitors we’re getting gives me an idea of whether more people are deciding the content I’m creating is useful and consistent enough to come back
Belle Beth Cooper, Ghost
Let’s see how you find your returning user count.
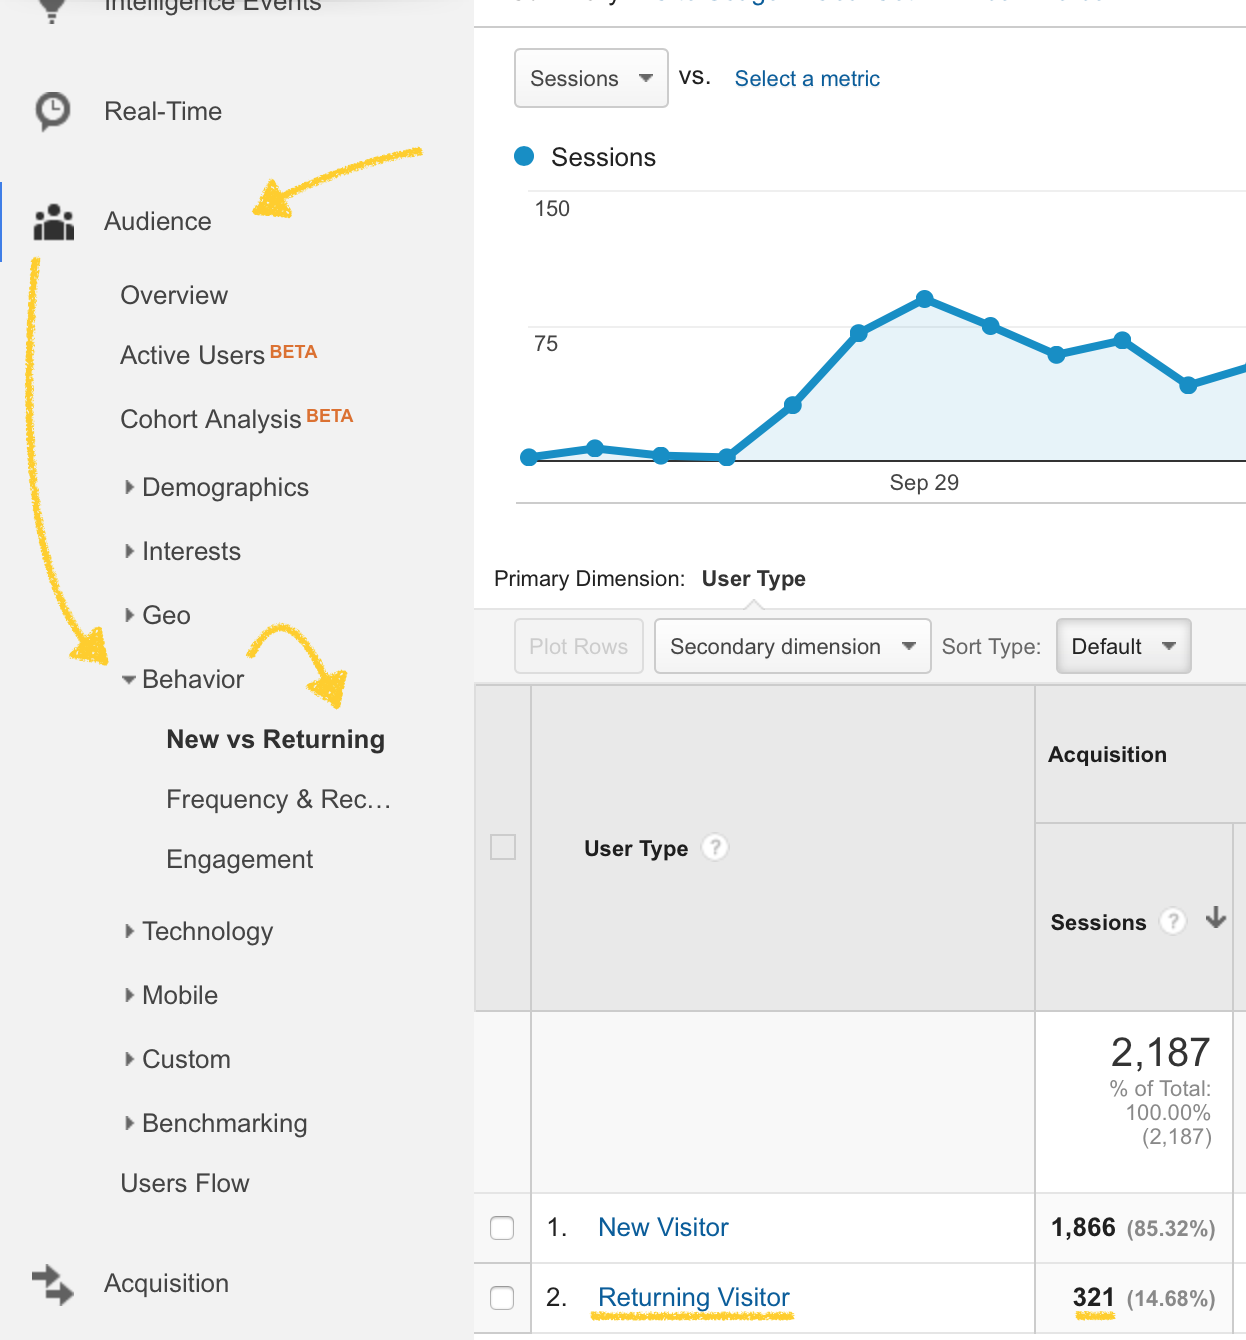
- Click on Audience in the sidebar
- Click Behaviour
- Click New vs Returning
- Your returning user count will be next to Returning Visitor
As you can see, ours isn’t looking so neat at the moment. I now know that it’s something we need to work on improving. Thanks Google Analytics! 😉
Total users
Total views shows you, well, how many people in total visited your site. This includes returning and unique users. It’s useful if you want to know how many people are visiting your site at a glance.
Here’s how to dig it out.
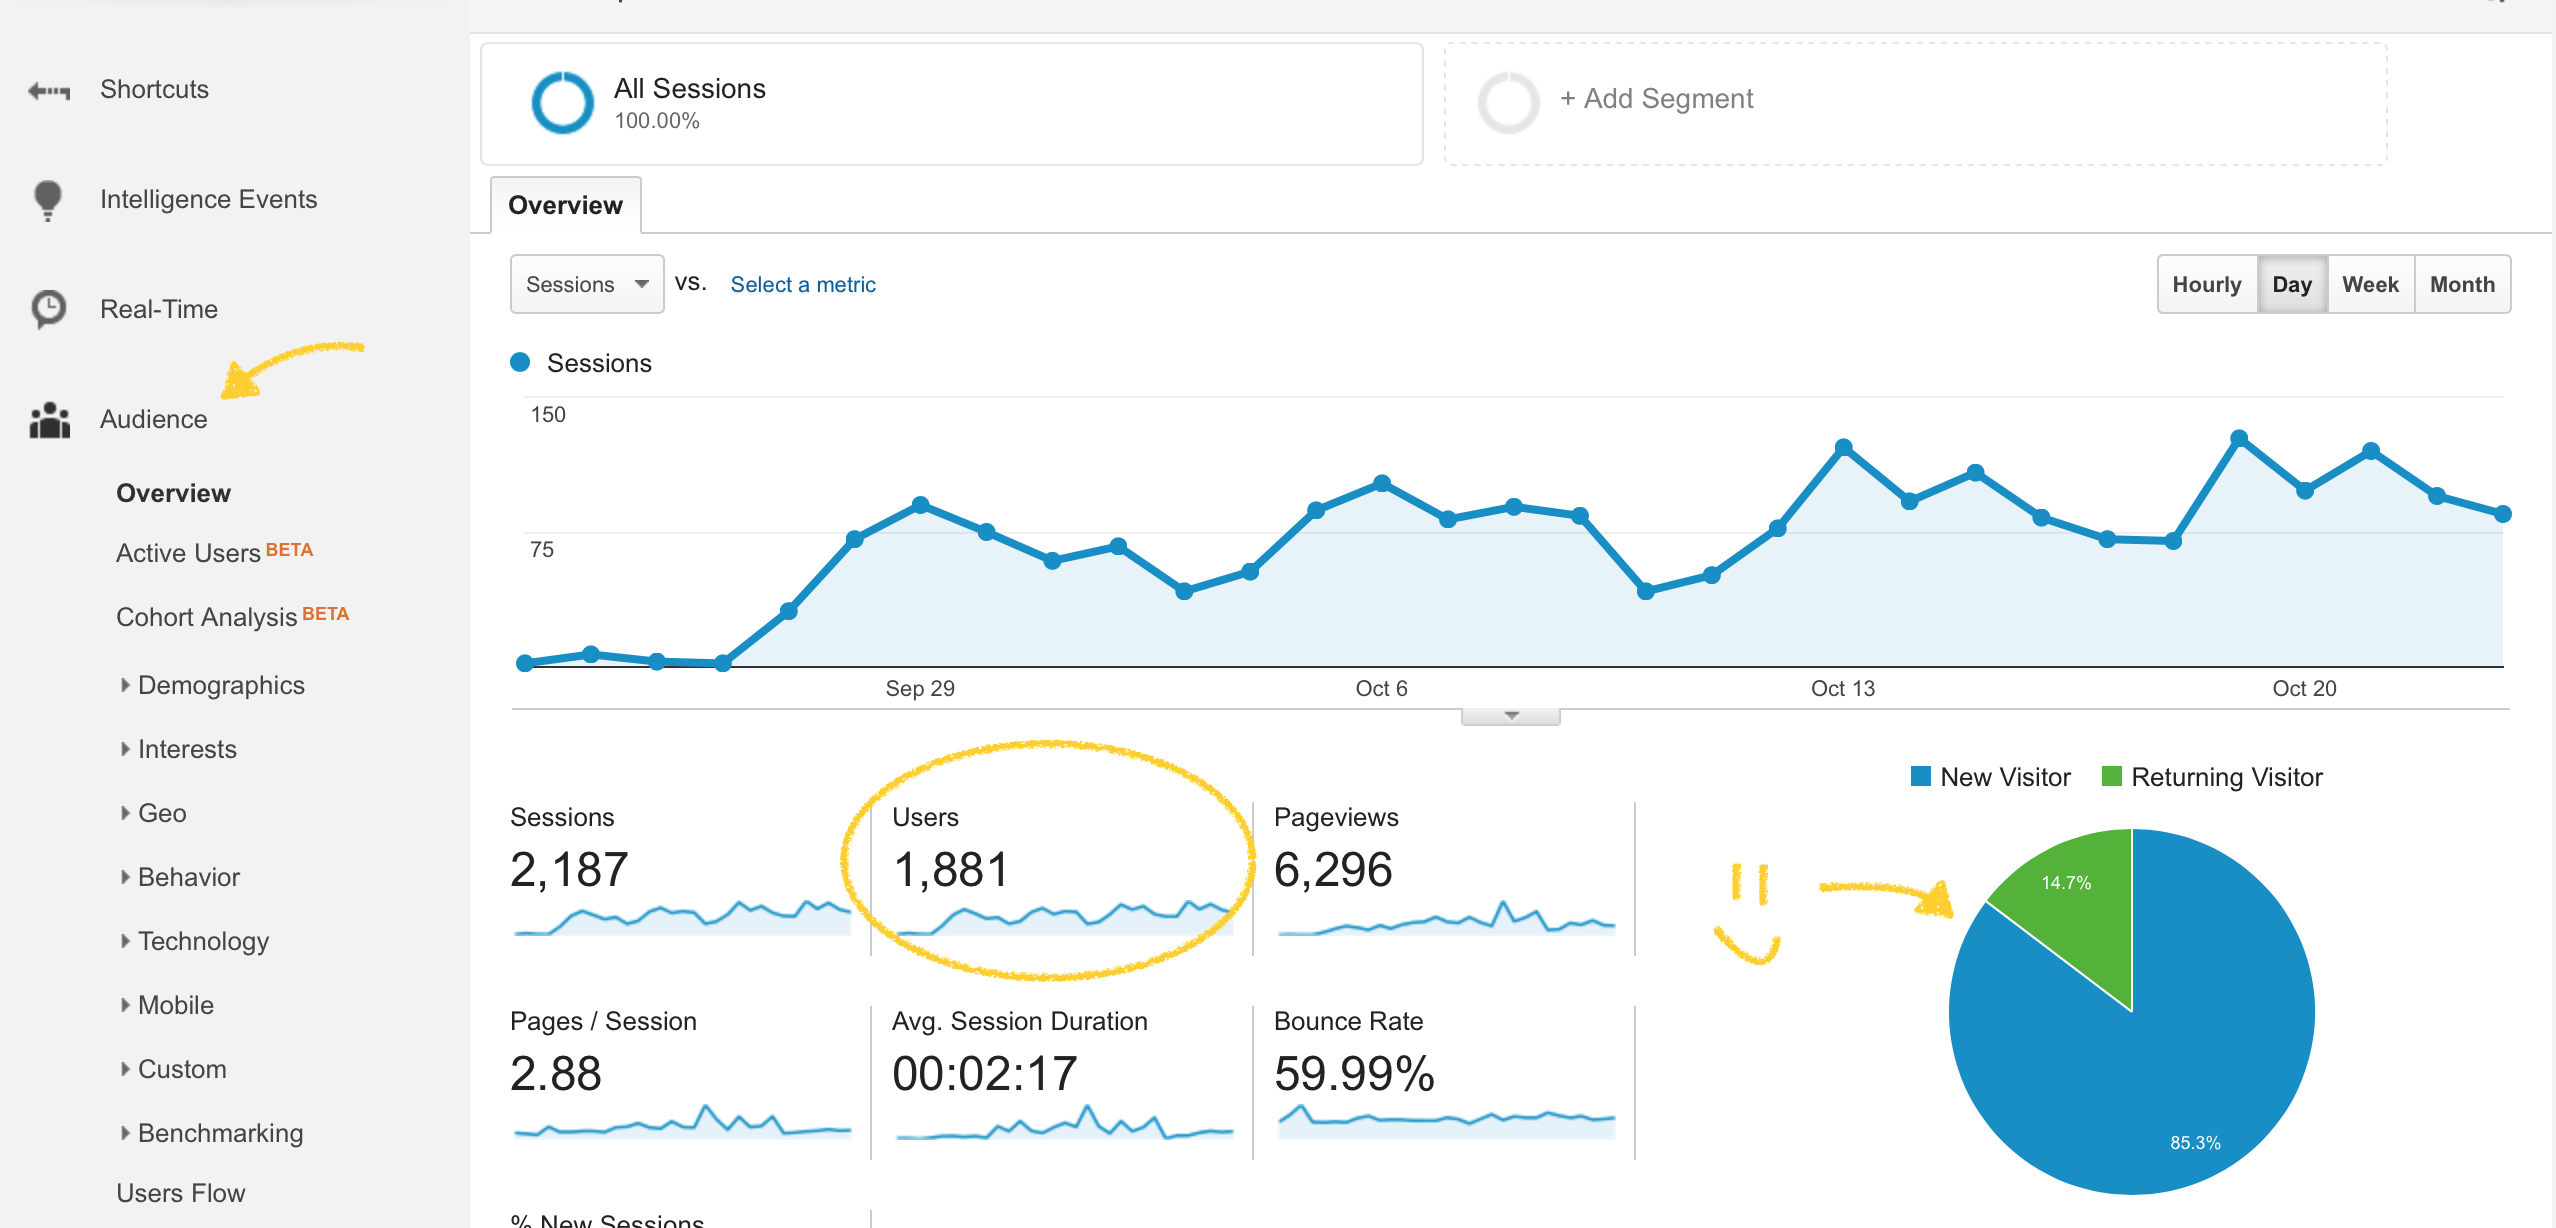
- Click on Audience in the sidebar
- Click on Overview
- Your total user count will be on the right under Users
You may also notice the handy pie chart. It’s your friend. It’ll quickly show you how many users are returning compared to how many are new. Very handy.
Analysing inbound traffic

Where does the majority of your traffic come from and where do they go when they end up on your website? Here are a few useful measurements to help you answer both of those questions.
Source/Medium
Knowing where your traffic is (and isn’t) coming from is a huge help. That way, you can focus on the channels that help you gain readers and not on the ones that don’t.
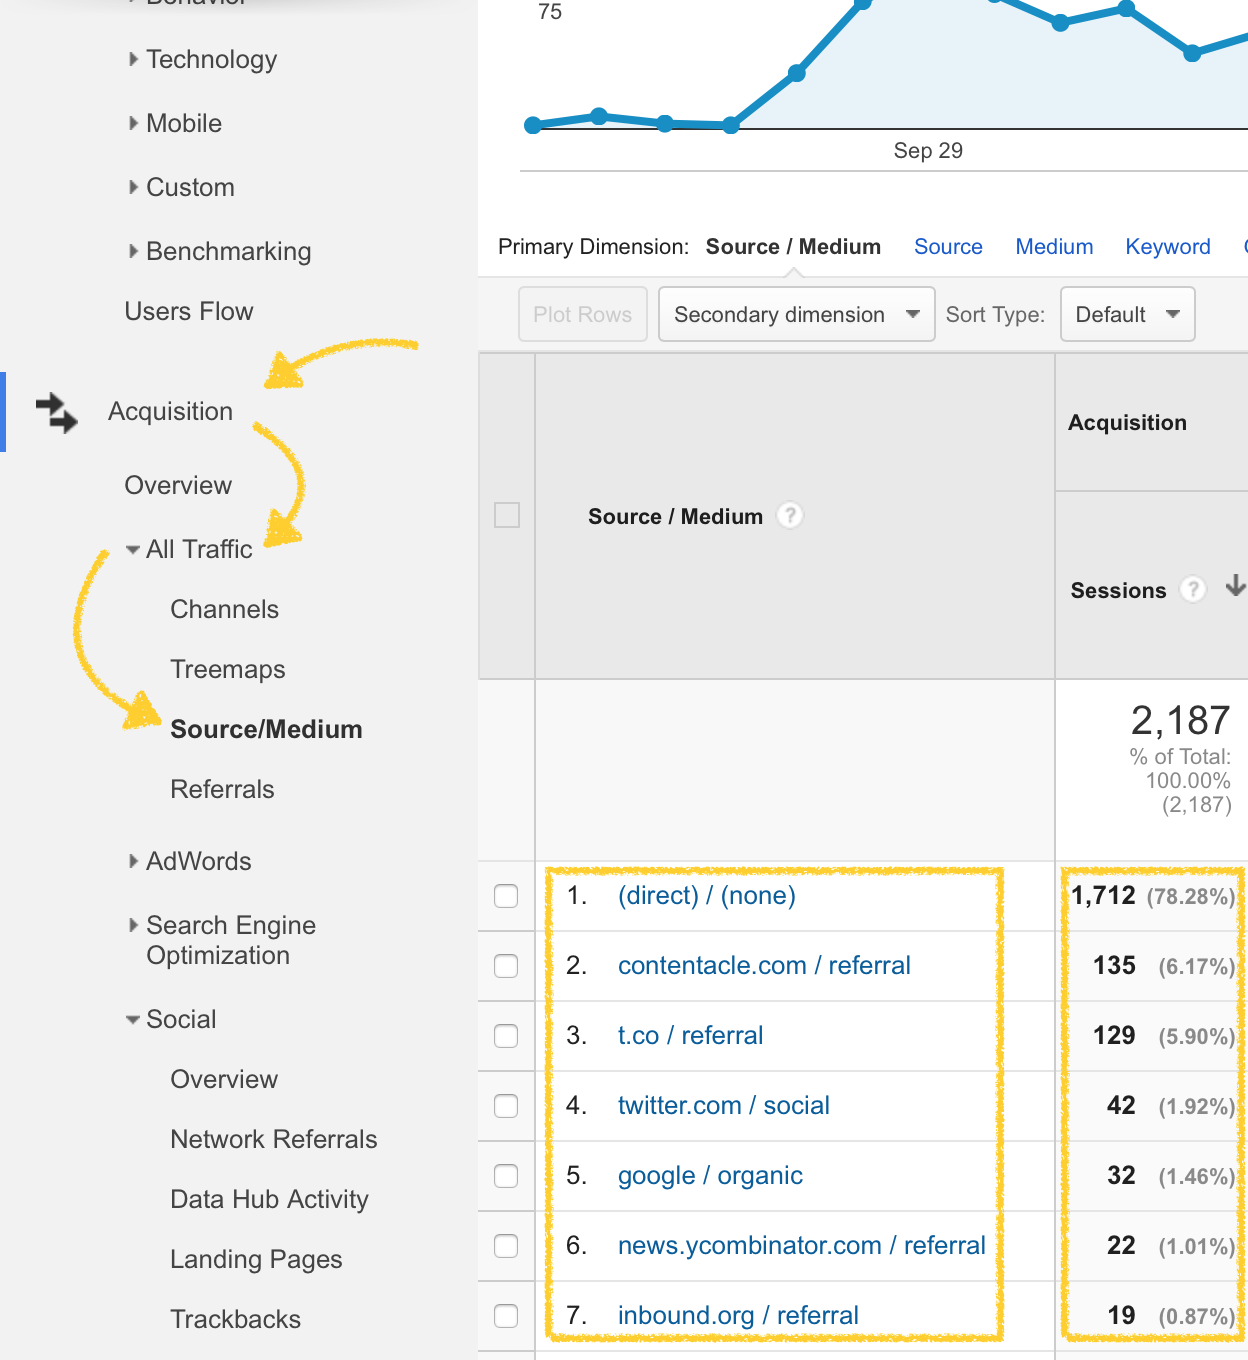
Getting to the data is pretty easy.
- Click on Acquisition in the sidebar
- Click on All Traffic
- Click on Source/Medium
- Your total referral counts (number of visitors from each source) will be on the right under Source/Medium
We can see that the majority of our traffic is direct, with Twitter being a great platform of promotion for us.
User Flow
Knowing where your users are going when they’re on your blog is useful information. A question like ‘Which post leads the most readers to the home page?’ can be answered using the User Flow.
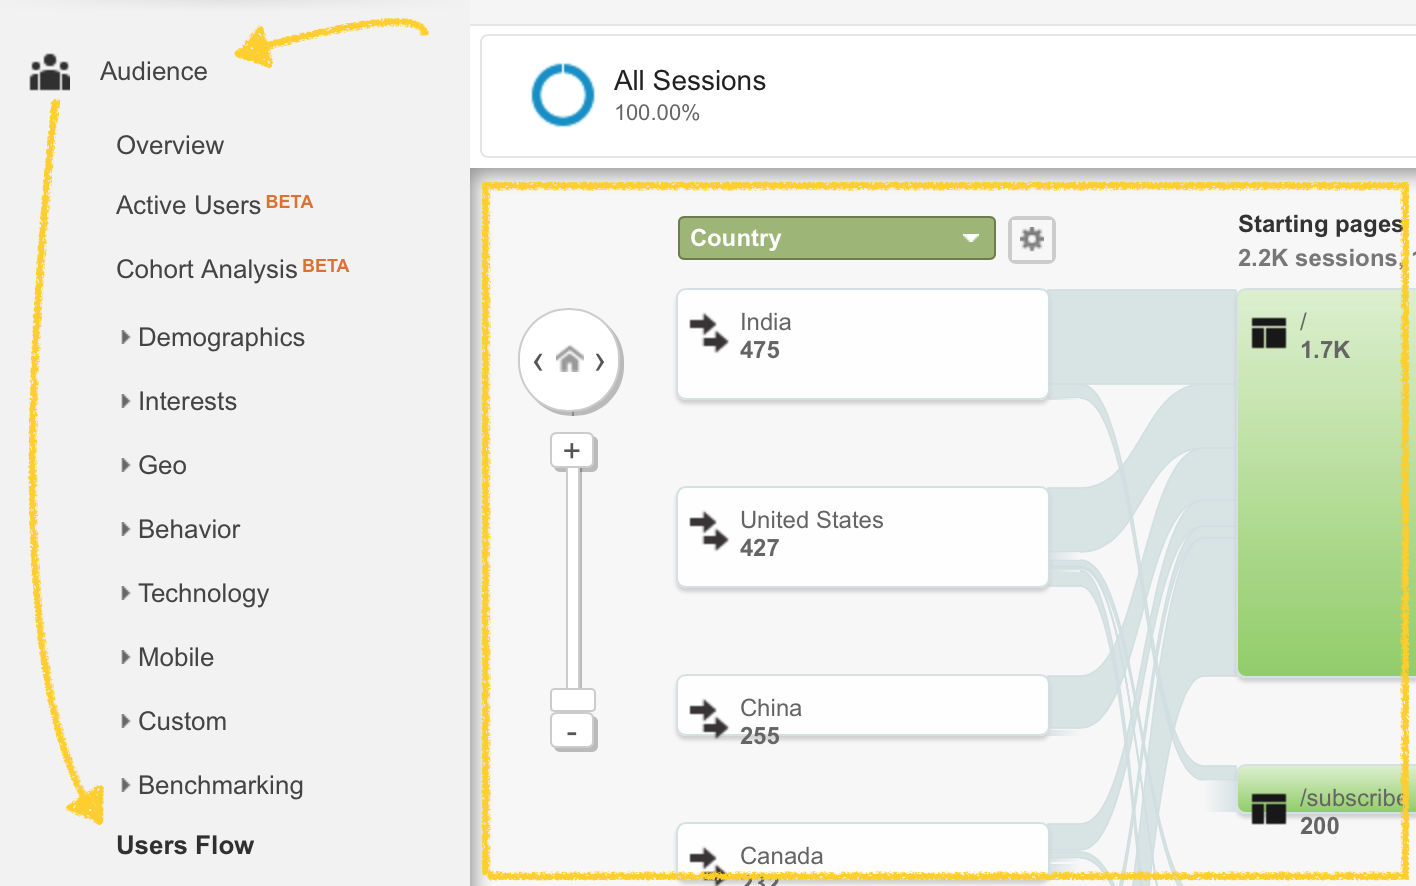
To get to your own user flow data:
- Click on Audience in the sidebar
- Click on Users Flow
- Your users flow will be on the right
Have a look around the flows. Follow their steps and see if there’s anything you think might be related to them leaving. Clicking a step in the flow lets you highlight all traffic through that point. Pretty neat, right?
Session duration
A user visiting your site and viewing one or more pages is known as a session. If they leave and come back again, that’s another session. The session duration is the amount of time the user spent on your site during just that session, not the whole day.
A longer session duration generally means your readers are more engaged. You should aim to increase your session duration, and you can tweak your content, images or website to do that.
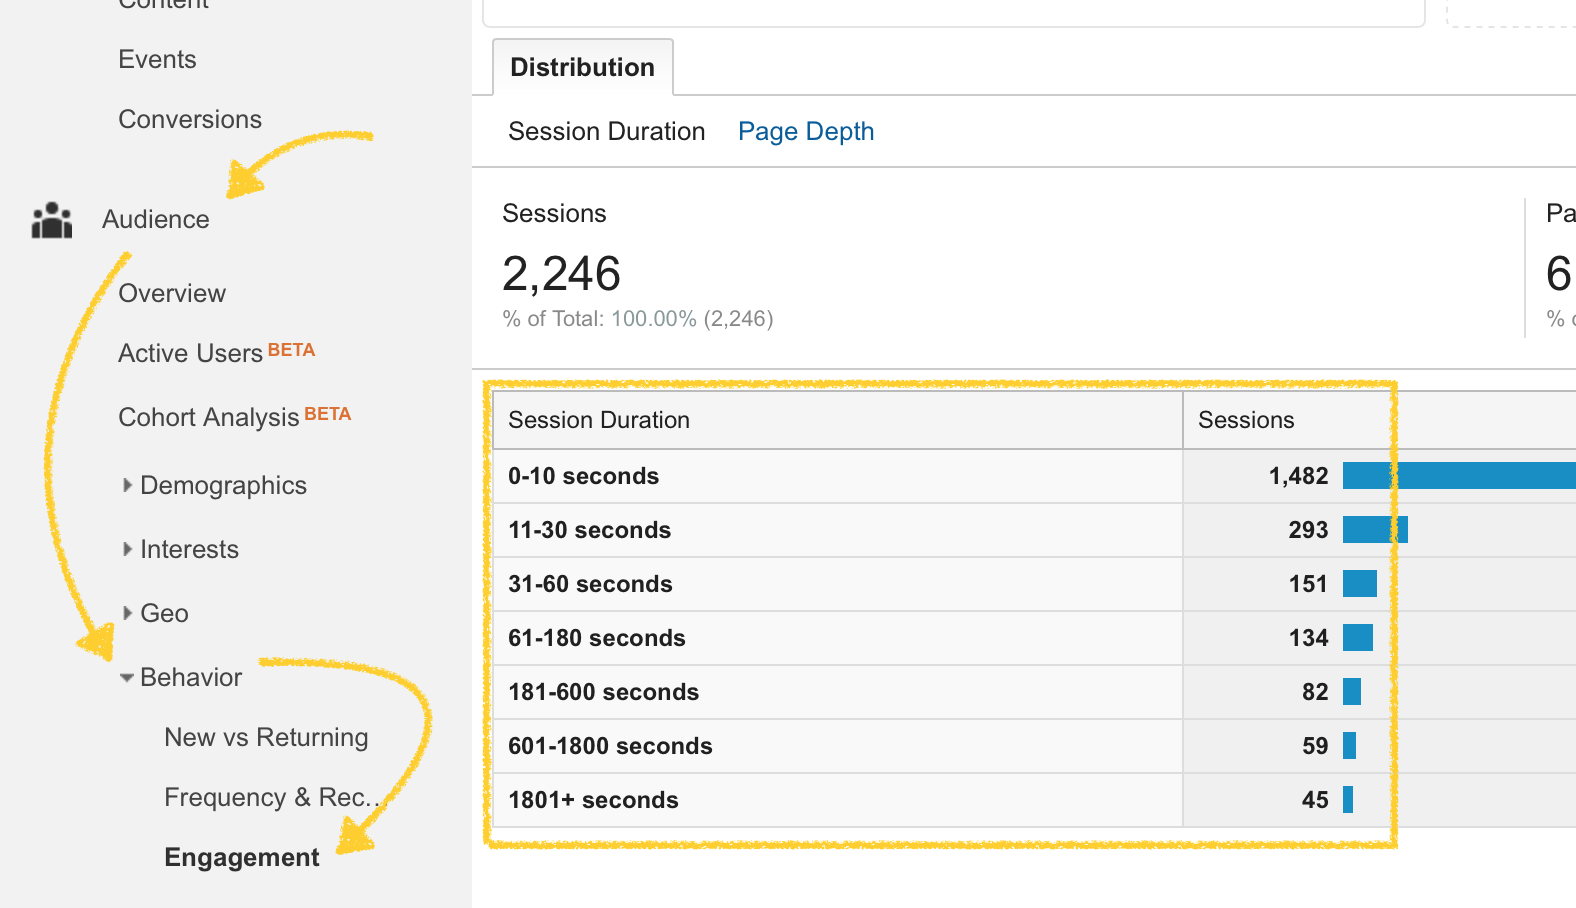
To see your session duration data:
- Click on Audience in the sidebar
- Click on Behaviour
- Click on Engagement
- The session durations are on the right
Things that can improve the session duration include: * Creating videos * Crafting guides * Giving away free tools.
Bounce rate
Bounce rate. It’s something that’s really tough to reduce. To put it simply, bounce rate is the amount of people that only view one page of your website, and don’t go through to view another.
A good bounce rate is anywhere between 1% - 70%. A bad bounce rate is usually above 70% - it means that 7 out of 10 people are leaving your site after one view. Not a good sign.
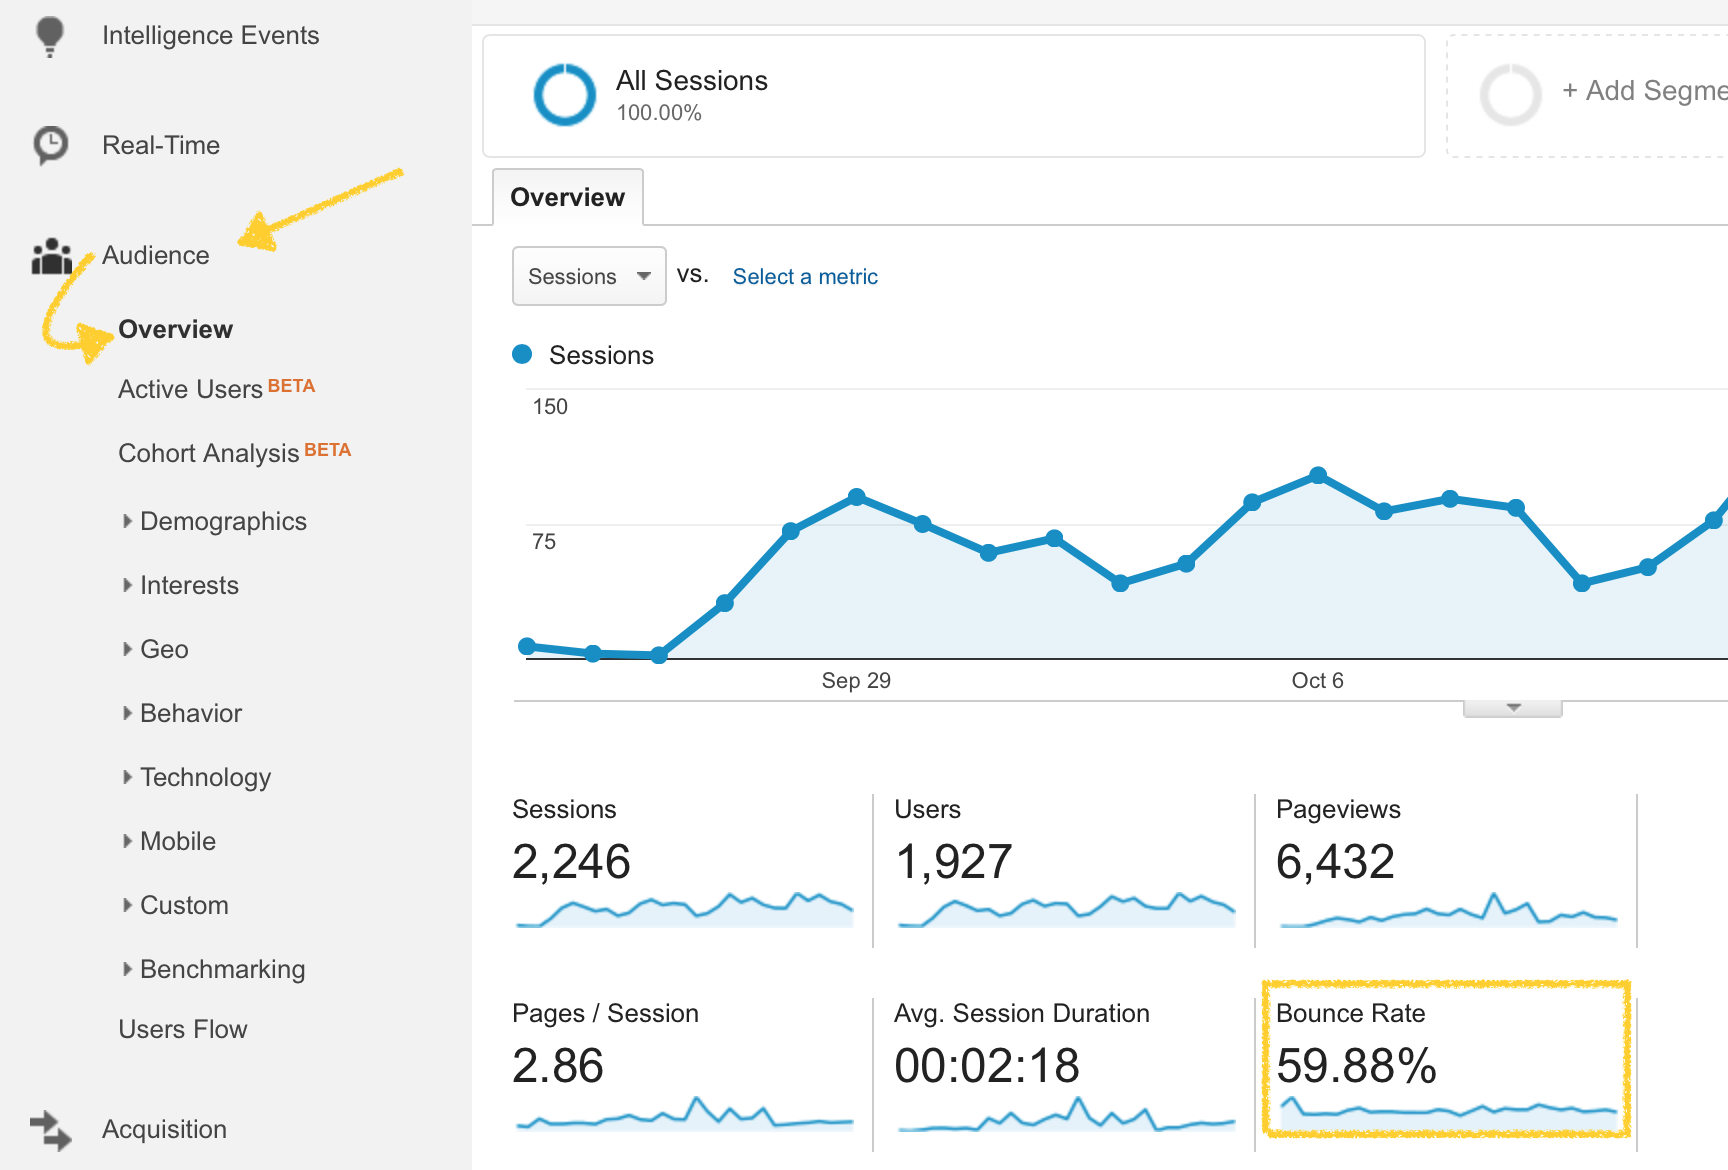
To view your bounce rate:
- Click on Audience in the sidebar
- Click on Overview
- The bounce rate percentage is on the right
If you have a high bounce rate, consider linking to relevant articles on your website that you’ve written before, and make the link text enticing.
Things to take away
Set specific goals on analytics when marketing inbound. Work towards something and set goals. Don’t make them unachievable, and also know the steps you’ll go through to get there.
What does your blog need? Whether it’s a boost in traffic, better content or building an email list, make sure you focus on the right goal(s) for you and your team.